Abstract
Fault surfaces like those displayed in Figure 1 are an important aspect of subsurface geology that we can derive from seismic images. Fault displacements, also shown in Figure 1, are important as well, as they enable correlation across faults of subsurface properties.
Figure 1: Close-up views of roughly conical (a) and planar (b) fault surfaces and fault throws computed automatically from a 3D seismic image. Vertical and horizontal image slices are shown in the background. Vertical components of fault throws are measured in ms because the vertical axis of the image is time. Each quadrilateral in the fault surfaces intersects exactly one edge of the 4 ms by 25 m by 25 m image-sampling grid.
In the context of exploration geophysics, fault throw, relative displacement up or down along the dip of a fault, is usually larger than fault heave, displacement along the strike of a fault. Moreover, fault throw vectors are usually more perpendicular to geologic layers, and therefore easier to estimate, than are fault heave vectors.
After estimating fault throw vectors, we can undo faulting. Figure 2 displays multiple fault surfaces and corresponding fault throws computed for a 3D seismic image, before and after this unfaulting process. After unfaulting, seismic reflectors are more continuous across faults, suggesting that estimated fault throws are generally consistent with true fault displacements. We estimate the fault throws required for unfaulting by analyzing seismic image samples gathered from opposite sides of fault surfaces extracted from fault images.
Figure 2: Fault surfaces and fault throws for two different subsets of a 3D seismic image before (a,b) and after (c,d) unfaulting. Unfaulting enhances the continuity of seismic reflectors.
Fault images, surfaces, and throws
Figure 3 illustrates new solutions to three problems: (1) computing 3D fault images, (2) extracting fault surfaces, and (3) estimating fault throws. Although each of these three solutions was designed in conjunction with the others in the sequence, aspects of any one of them could be adapted to enhance other methods used today.
We first compute 3D fault images of an attribute we call fault likelihood, shown in Figure 3b. Much like Cohen et al. (2006), we scan over multiple fault strikes and dips to maximize this semblance-based attribute. However, the computational cost of the algorithm we use to perform this scan is independent of the number of samples used in the averaging performed for each fault orientation. Our implementation of this scan for 500 potential fault orientations requires less than two hours to process a 3D image of 1,000,000,000 samples on a modern workstation.
Figure 3: From a 3D seismic image (a) we automatically compute fault images (b), extract fault surfaces (c), and estimate fault throws (d).
We then use the resulting 3D images of fault likelihoods, dips, and strikes to extract fault surfaces (Figures 1 and 3c) using a method that is most similar to one demonstrated by Schultz et al. (2010) in the context of medical imaging. These fault surfaces are ridges in 3D images of fault likelihood, and are represented by meshes of quadrilaterals, like those shown in Figure 1. We have made no attempt to fill any of the small holes apparent in these surfaces, although such a filling process would be easy to implement because every quadrilateral is linked to its neighbors. The fact that holes are small is due to the continuity of ridges in the 3D images of fault likelihood.
Finally, we compute fault throws from differences in values of samples gathered from 3D seismic images alongside the fault surfaces. The algorithm we use to compute fault throws is derived from a classic dynamic programming solution (Sakoe and Chiba, 1978) to a problem in speech recognition. That solution today is often called dynamic time warping and is here extended to find a spatial warping that best aligns samples of 3D seismic images alongside faults, as illustrated in Figures 2 and 3d.
Figure 4: Using fault throw vectors estimated for a 3D seismic image (a), we automatically unfault (b) and unfold (c) seismic reflectors to compute an image in which reflectors are flat. Each horizontal plane in a flattened image corresponds to one seismic horizon (d) in the original image.
Unfaulting, unfolding, and horizons
Figure 4 illustrates how fault throw vectors facilitate further processing, enabling a seismic image to be unfaulted and unfolded to flatten reflectors, and how the mapping from a seismic image to its corresponding unfaulted and unfolded image can be used to obtain geologic horizons. Such horizons are useful for interpretation of stratigraphic features and analysis of structural deformation, as well as interpolation and correlation of subsurface properties.
We assume that every geologic horizon was initially deposited as a horizontal layer and subsequently subjected to folding and faulting. So in order to extract a horizon, we must quantify the folding and faulting apparent in a seismic image. We first estimate fault throw vectors as described above, and then unfault a seismic image using a field of vector shifts obtained by interpolating estimated throw vectors between faults. Figure 4a displays slices of an unfaulted image computed in this way. Notice that reflectors are more continuous after this unfaulting process.
In the unfolding process illustrated in Figure 4c, we compute and apply another field of shift vectors that flatten seismic reflectors. This automatic process is similar to those described by Stark (2004) and Lomask et al. (2006), except that our shift vectors need not be vertical. They may (and typically do) have non-zero horizontal components. We compute these vector shifts to, ideally, preserve various metric properties such as lengths, areas, and angles within horizon surfaces, and layer thicknesses measured perpendicular to horizon surfaces.
An isometric vector field, one that preserves all of these metric properties, is seldom appropriate, due to unconformities, varying sedimentation rates, and other factors. Therefore, in the system of partial differential equations that we solve when computing vector shifts for unfolding, we give more weight to flattening and less weight to preserving the metric properties.
We can describe the sequence of unfaulting and unfolding by a composite field of shift vectors that is easily computed from the vector fields used for unfaulting and unfolding. For any sample in the flattened image Figure 4c, a vector in this composite field tells us where to find the corresponding sample in the original seismic image (Figure 4a). By collecting all such vectors for all points in a horizontal plane in the flattened image, we obtain a geologic horizon like that shown in Figure 4d. In this way we can construct automatically, without any manual picking or horizon tracking, a horizon for any sample in a 3D seismic image.
References
Cohen, I., N. Coult, and A. Vassiliou, 2006, Detection and extraction of fault surfaces in 3D seismic data: Geophysics, 71, P21–P27.
Lomask, J., A. Guitton, S. Fomel, J. Claerbout, and A. Valenciano, 2006, Flattening without picking: Geophysics, 71, P13–P20.
Sakoe, H., and S. Chiba, 1978, Dynamic programming algorithm optimization for spoken word recognition: IEEE Transactions on Acoustics, Speech, and Signal Processing, 26, 43–49.
Schultz, T., H. Theisel, and H.-P. Seidel, 2010, Crease surfaces: from theory to extraction and application to diffusion tensor MRI: IEEE Transactions on Visualization and Computer Graphics, 16, 109–119.
Stark, T., 2004, Relative geologic time (age) volumes – Relating every seismic sample to a geologically reasonable horizon: The Leading Edge, 23, 928–932.
Biography
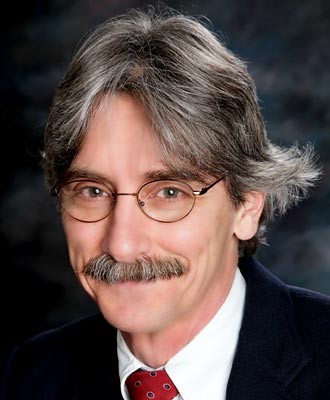
Dave Hale received a B.S. in physics from Texas A&M University in 1977 and a Ph.D. in geophysics from Stanford University in 1983. He has worked as a field seismologist and research geophysicist for Western Geophysical, as a senior research geophysicist for Chevron, as an associate professor at the Colorado School of Mines, as a chief geophysicist and software developer for Advance Geophysical, and as a senior research fellow for Landmark Graphics. In 2005, he returned to Mines as the C.H. Green Professor of Exploration Geophysics.
Dave received the Virgil Kauffman Gold Medal from the Society of Exploration Geophysics for his work on dip-moveout processing of seismic data. He also received the SEG's awards for Best Paper in Geophysics in 1992 (imaging salt with seismic turning waves) and Best Paper Presented at the Annual Meeting in 2002 (atomic meshing of seismic images). He taught the SEG''s first course in dip-moveout processing as part of the Continuing Education program, and was editor of "DMO Processing", volume 16 of the Geophysics reprint series.


