Abstract
SUMMARY
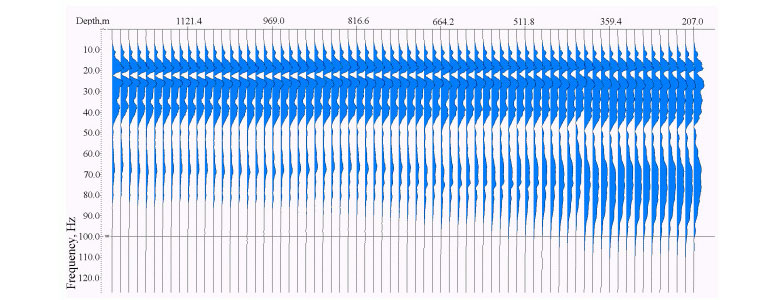
A new method for restoring high frequencies within the seismic bandwidth has been developed. This is different from any of the conventional methods practiced in the industry and utilizes the amplitude/frequency decay experienced at different VSP depth levels in a well. For VSP downgoing signals recorded at different depth levels, the ratio of change in trace amplitudes at successive depths would describe the decay of frequency components between those observation points. This fact is utilized to first determine the amplitude decay resulting from frequency attenuation from downgoing VSP traces and then used to restore those frequency components that have been attenuated in the surface seismic data.
The procedure is robust, yielding better defined stratigraphy and more confident interpretations. The method can redefine prospects, which may have been declared fruitless based on interpretation of seismic data with poor bandwidth.
INTRODUCTION
Often we come across examples where the first-effort processing of a 3D seismic volume leads to interpretations that are geologically suspect, e.g. cases involving complex faulted patterns or subtle stratigraphic plays. Similarly, dry well analysis may cite fault displacements being small or seismic data being obscure as reasons for the dry holes. In such cases, the usual practice is to create a new version of the 3D volume, which has had some target oriented processing carried out. This is done to obtain some improvement in the zone of interest, which hopefully would lead to a more accurate interpretation. In some cases this helps, but in others still some questions remain unresolved.
More often than not, in such cases a more accurate stratigraphic interpretation is warranted, but the available bandwidth of the data is inadequate to image or resolve the thicknesses of many of the thin targets seen in the wells.
This problem can be addressed by having data of reasonable quality and augmenting it by some frequency restoration procedure that improves the vertical resolution. This enables confident mapping of subsurface horizons of interest, clarifies detailed geological settings, and leads to more profitable seismic exploration programs.
Seismic waves propagating in the subsurface are attenuated. This loss is frequency dependent -higher frequencies are absorbed more rapidly than lower frequencies, such that the highest frequency recovered on most seismic data is usually about 80Hz. Attempts have been made to determine the subsurface attenuation in terms of the attenuation constant (a) or the quality factor (Q). The conventional methods used for their determination from surface seismic data, have limitations and also have a certain level of uncertainty.
A new method (patented) for restoring high frequencies within the seismic bandwidth has been developed. This is different from any of the conventional methods practiced in the industry and utilizes the amplitude/frequency decay experienced at different VSP depth levels in a well.
RESTORING HIGH FREQUENCIES IN SURFACE SEISMIC
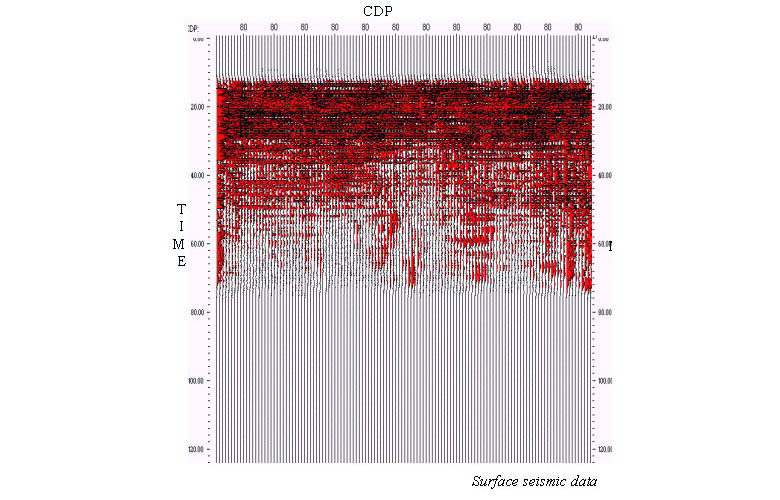
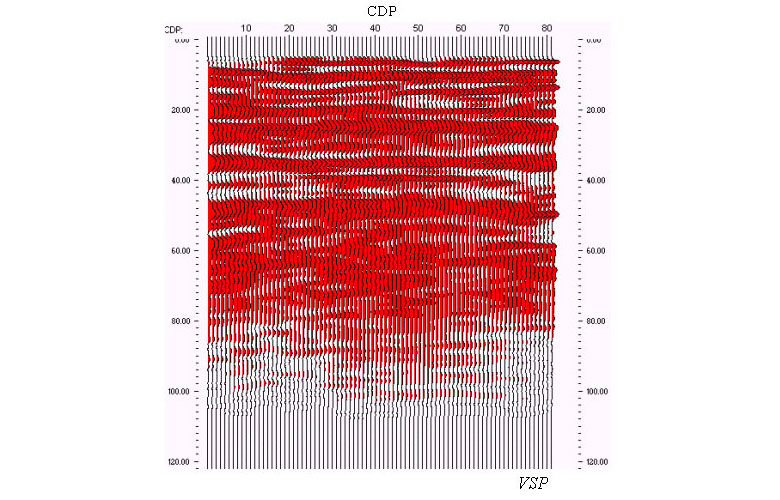
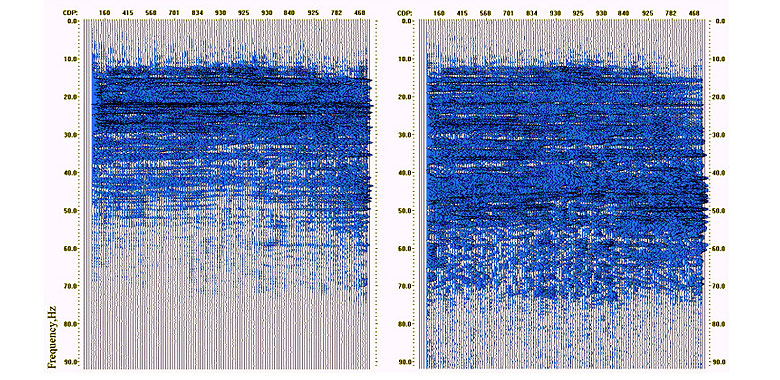
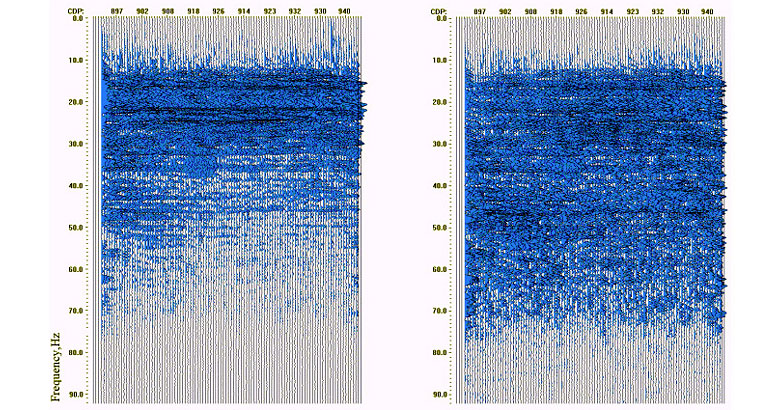
It is well known that VSP data records higher frequency data than surface seismic data. This is because the energy recorded by the VSP traverses the unconsolidated weathering zone just once. To confirm this, sectional amplitude spectra were computed for a profile through spatially coincident 3D seismic and 3D VSP volumes. As seen in Fig.1, whereas the frequency content of the surface seismic data extends to 60-65 Hz, it increases to 90 Hz in the 3D VSP data. It is therefore advisable to utilize the higher frequency range of VSP data to enhance the bandwidth of the surface seismic data.
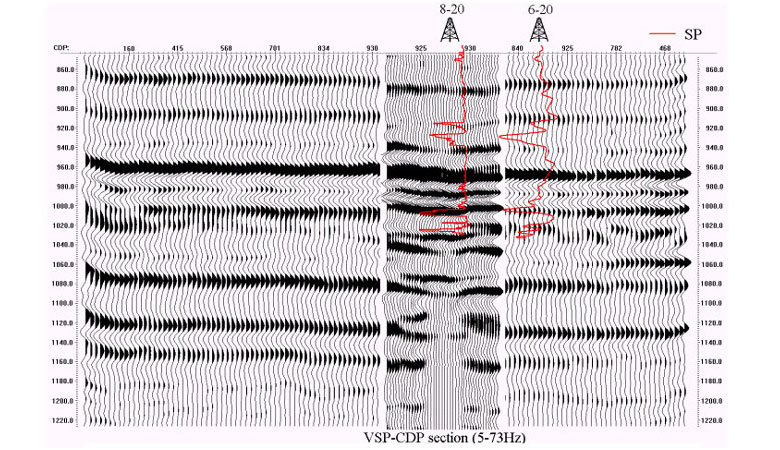
For application to surface seismic data, the VSP upgoing wavefield is correlated with the CDP section, as shown in Fig.3 so that each depth level point is seen in terms of two-way time (on the seismic section) where the determined operators need to be applied. This way the time window for application of the operators is determined. Thereafter, the string of the determined operators is run (as convolution (in time domain)) on the seismic data.
A 3D VSP and a coincident 3D surface seismic survey were recorded around well 8-20 in the Hanna area of Central Alberta, targeting the Lower Mannville formation (Chopra et al 2002). The well encountered a gross Lower Mannville interval 20.5 m thick and thicker than the adjacent wells 6-20 (11.5 m) and 8-21 (7m). The 3D seismic programs (surface and VSP) were recorded to assist in defining sand presence and porosity development in the Lower Mannville interval found at a depth of between 1300.0 and 1350.0m. The objectives set for the 3D VSP recording were to (a) tie the seismic reflections to lithology and stratigraphic boundaries, (b) obtain a high frequency image around the borehole (the fixed receiver array and its proximity to the reservoir are expected to improve image quality), and (c) obtain an improved subsurface velocity model.
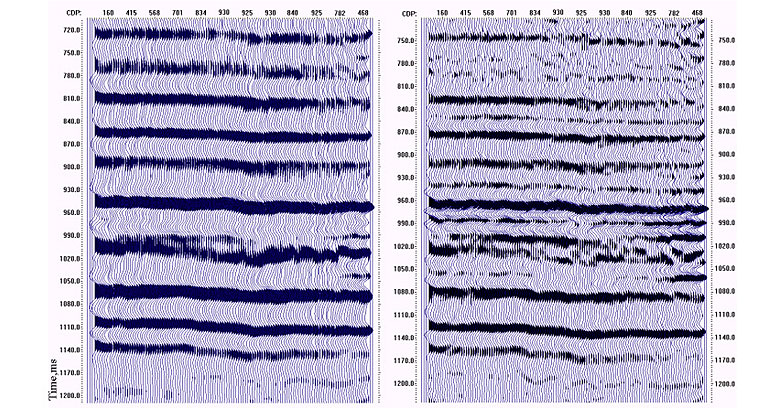
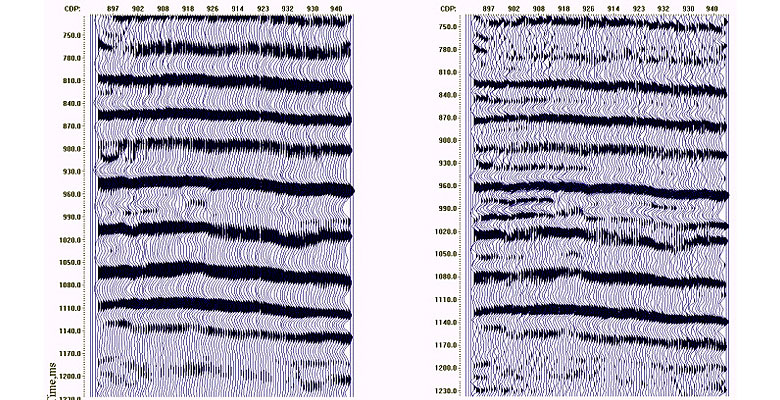
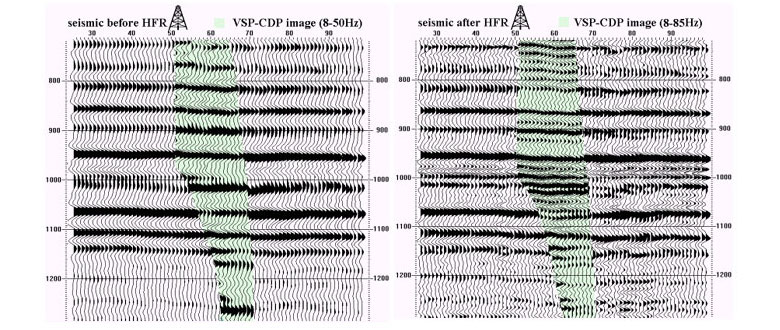
The above frequency enhancement procedure called high frequency restoration (HFR) was run on the seismic data. Fig.4 shows a segment of seismic inline 85 with and without HFR. Notice the improvement in resolution continuity. Similarly, Fig.6 shows cross-line 72 before and after HFR and the extent of enhancement may be seen in amplitude spectra for the two lines in Fig.5 and Fig.7. The reflections at the indicated levels (arrows on the left) exhibit more continuous reflections, and also the match with the corridor stack is much better at the level of interest. Fig.8 shows inline 85 after frequency enhancement and a comparison with the vertical section through the 3D VSP volume. There is a good correlation now between the two. Stratigraphy, VSP upgoing wavefield and VSP corridor stack may be seen correlated with inline 85 after HFR in Fig. 3. Fig. 9 (a) shows an offset VSP-CDP profile extracted from a 3D VSP and overlain onto inline 85 from the 3D seismic volume. The VSP profile has been bandpass filtered (8-50 Hz) to match the frequency content of the seismic data. The good matching of different reflection events is evident but the frequency bandwidth is low. The same matching is also shown (Fig.9(b)) after HFR.
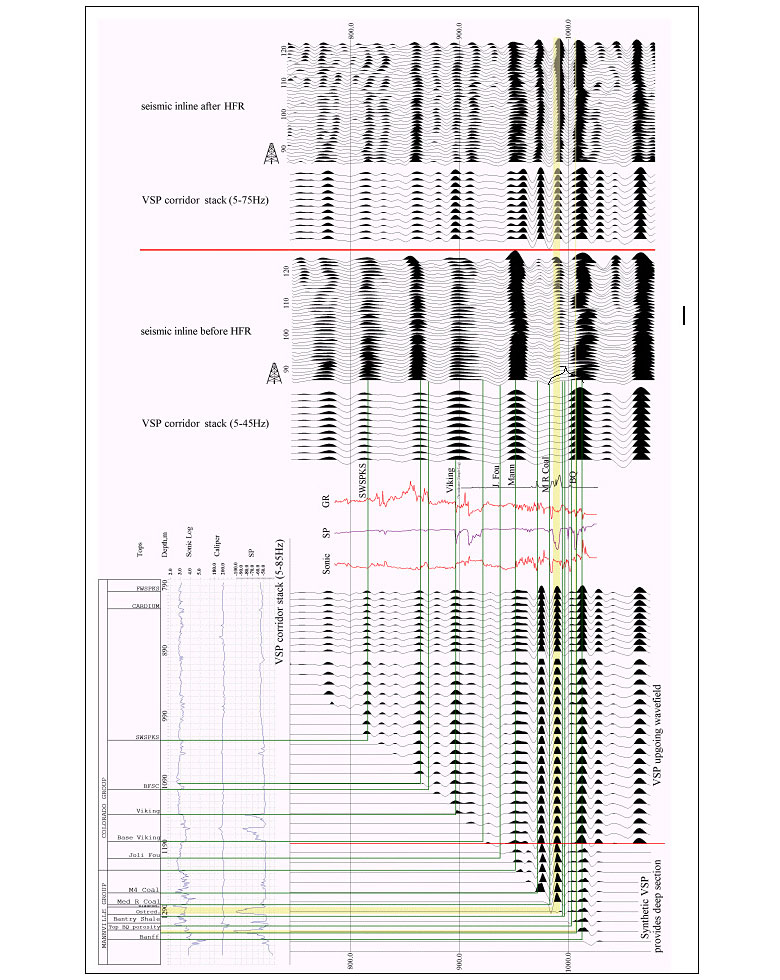
In this case the VSP-CDP profile is filtered to 8-85 Hz. Notice the high frequency bandwidth of both the profiles and the higher level of detail available for interpretation.
EVALUATING IMPROVEMENT IN FREQUENCY ENHANCEMENT USING COHERENCE CUBE
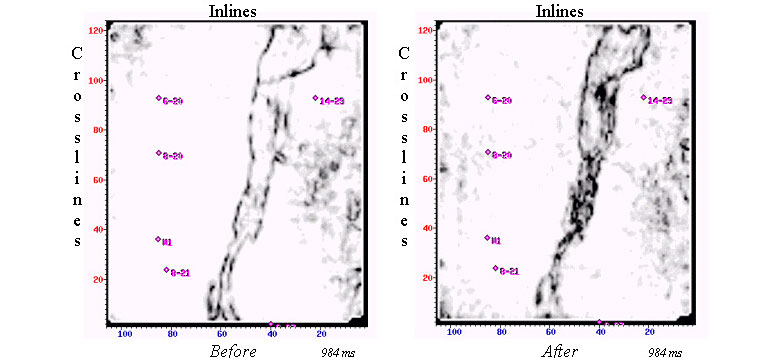
Coherence CubeTM (Bahorich and Farmer, 1995, Marfurt et al, 1998, Marfurt et al, 1999, Chopra and Sudhakar, 2000, Chopra et al, 2000, Chopra,2001). is an excellent tool for imaging faults and stratigraphic features in 3D seismic data volumes. Time or horizon slices across Coherence Cubes are useful for following faults and stratigraphic features in map views, free from the possible bias by the interpretation. Coherence Cube was run on the two seismic volumes, before and after filtering, to examine the differences that are caused by the HFR process. Fig.10 shows time slices at 984 ms. The important thing to note here is that these patterns are more distinct and more detail is evident after filtering. HFR yields a clearer image for interpretation.
Fig.11 shows time slices at 1024 ms before and after HFR. Between wells 6-20 and 8-20, there is a low coherence trend after filtering which may explain the difference in the nature of the two wells. These trends are not so obvious on the slice in before filtering. HFR has defined trends better and should yield a more confident interpretation.
CONCLUSIONS
Due to the absence of strong impedance contrasts above and below the zone of interest, the surface seismic reflection data do not show any significant reflection detail within the zone of interest. A procedure was devised to determine the decay in amplitude from downgoing VSP first arrivals from successive depth levels and then apply the inverse decay function to seismic data. This application has illustrated the usefulness of the procedure. The poor reflection zone in the seismic volume shows greater reflection detail and continuity which match better with the corridor stack and vertical 3D VSP sections. This has helped meet the objectives for the surveys. The high frequency enhancement of the seismic data was evaluated by running Coherence Cubes on the seismic volumes before and after filtering. The HFR procedure described here helped define trends better and led to more confident interpretations. Such applications could redefine prospects, which in some cases may have been declared unsuccessful, when the interpretations are based on seismic data with poor bandwidth.

ACKNOWLEDGEMENTS
Coherence Cube is a trademark of Core Laboratories.
We would like to thank Conoco Canada Resources for release of data and thank Scott Pickford, Canada for permission to publish this paper.
REFERENCES
Bahorich, M. and Farmer, S. 1995, The Coherence Cube, The Leading Edge, 14(10), 1053-1058.
Chopra,S. and Sudhakar,V ,2000, Fault interpretation - the coherence cube and beyond, Oil and Gas Journal, July 31, 71-74.
Chopra,S., Sudhakar, V., Larsen,G. and Leong,H., 2000, Azimuth based coherence for detecting faults and fractures, World Oil, September, 57-62.
Chopra,S., 2001, Integrating coherence cube imaging and seismic inversion, The Leading Edge, 20(4), p354-362.
Chopra, S.,Blias,E., Chavina,L.,Alexeev, V, 2002, Simultaneous acquisition of 3D surface seismic and 3D VSP data - processing and integration, This issue.
Marfurt,K.J., Kirlin,R.J., Farmer,S.L. and Bahorich,M.S., 1998, 3-D seismic attributes using a semblance-based coherency algorithm, Geophysics, 63(4), 1150-1165.
Marfurt,K.J.,Sudhakar,V.,Gersztenkorn,N,A., Crawford,K.D. and Nissen,S.E., 1999, Coherency calculations in the presence of structural dip, Geophysics, 64(1), 104-111.
Biography
Satinder Chopra has an M.Sc. and M.Phil. (Master of Philosophy) degrees in Physics from Himachal Pradesh University at Shimla in India. He began his geophysics career in 1984, with Oil and Natural Gas Corporation, the national oil-company of India. In 1998 he joined CTC Pulsonic, Calgary as Senior Geophysicist and is presently Manager, Special Projects at Scott Pickford, Calgary.
Satinder has presented or co-authored several papers at annual meetings and international journals on various topics covering special processing of seismic data and interactive interpretation. He has over 40 publications and has authored 3 books. He served as the Joint-Secretary of Society of Petroleum Geophysicists (SPG) (India) from 1992 to1997 and was the Editor of 'GEOHORIZONS', the flagship magazine of SPG. He was also the Editor of the Proceedings of the First International Conference of SPG held in New Delhi in 1996 and published under the title 'Emerging Technologies for Reservoir Exploration'. Satinder is the Production Editor of RECORDER, chairs the CSEG Web site committee and was a member of the Technical Committee for this year's CSEG National Convention. He is a member of CSEG, SEG, EAGE and SPG.