
Abstract
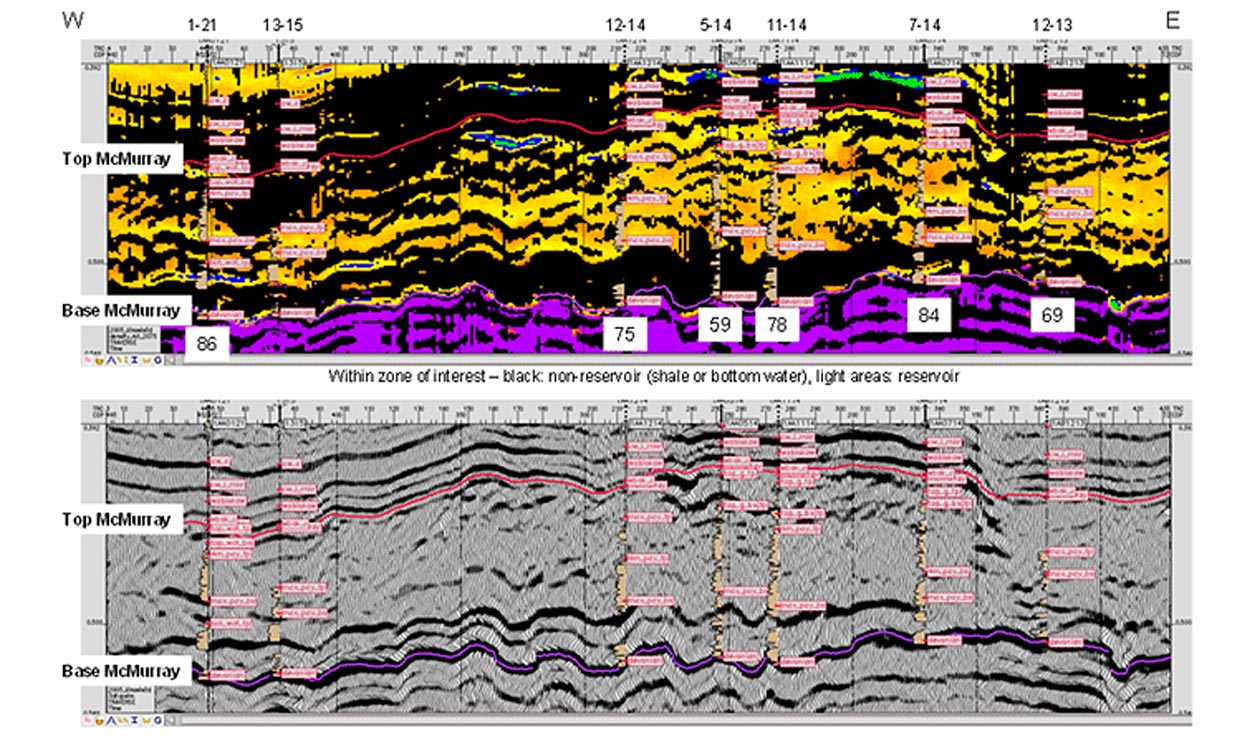
The Athabasca oil sands contain more than a trillion barrels of oil within the Cretaceous McMurray Formation of northeastern Alberta. In most of the oil sands area, the McMurray Formation is generally considered to be a compound estuarine valley system characterised by multiple cuts and fills. It is bounded below by Devonian rocks at the pre-Cretaceous unconformity and above by the widespread transgressive marine shales and sands of the Wabiscaw Formation. In the Long Lake area, it is 60 to 100m thick, with net pays of greater than 40m. Still, its complexity is legendary. Stacked channel deposition exhibits a high degree of reservoir variability both vertically and laterally making lithological predictability difficult.
Traditionally, at least 8 and often many more vertical wells per square mile are drilled and cored to obtain enough data to be confident in defining a SAGD1 project area. Even then, significant variations occur between wells. 3D seismic data has been used successfully in the past mainly to define the base of the zone of interest (there is a strong reflector at the Cretaceous-Devonian boundary), and the gross thickness of the interval. Various attempts have been made to decipher the internal composition of the channelled interval with limited success.
Objective
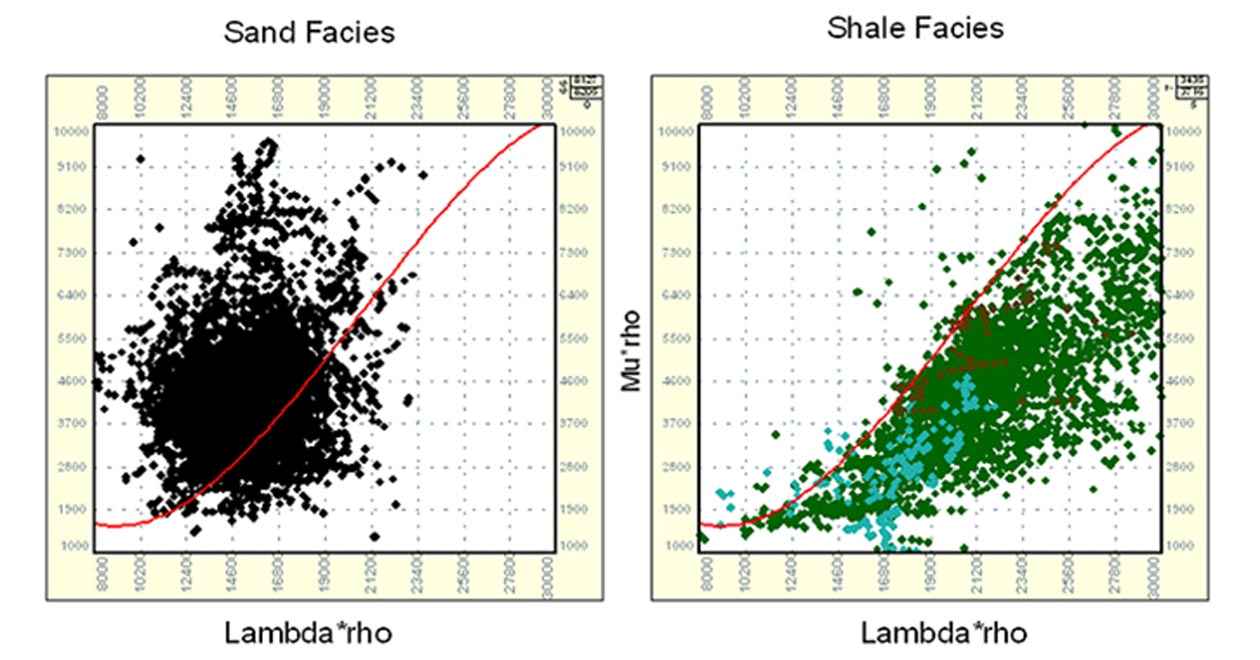
In this paper, I describe the method, application and results of a technique of quantitatively extracting and classifying elastic rock properties from seismic data. The extraction process uses AVO (amplitude vs offset) analysis to separate the compressional (P-wave) and shear (S-wave) components of the seismic data. The resulting components are then used to calculate physical rock properties2 such as shear rigidity (mu) and incompressibility (lambda). It is common knowledge among oil sands geoscientists that the density log through the McMurray Formation shows a strong correlation to the gamma ray log and is therefore a good lithology indicator. Recent work directed at determining facies from seismic relies on an estimate of density from the seismic data. In this process I incorporate an estimate of density obtained from seismic using a neural-network approach3.
Biography
Laurie Bellman has over 20 years experience in geophysics for the oil business. A physicist by training, she has applied her knowledge and skills to oil and gas exploration and production in many areas in the world.
Laurie started her career with Shell Canada doing seismic processing and interpretation in the central plains area of Alberta. Seeking adventure and travel, she took a position with LASMO plc in London, to work on various European, North African and Middle East projects. After joining Wascana Energy in London, she was transferred back to Canada to work domestic cold-flow heavy oil projects. Following a short sabbatical to focus on family, she began her consulting career with Alberta Energy (AEC) in 1999. She has contracted for a number of other companies and projects, but since 2000, her professional interest has been the Canadian oil sands. The unique challenges in that geological environment have provided her the opportunity to apply and develop state-of-the-art geophysical processes and workflows. She formed Oil Sands Imaging in 2007 to optimize seismic value for clients in this fascinating area.
Applying this technique over a project area allows more confident mapping of the channels and the reservoir quality and continuity within the channels. A few of the potential benefits in oil sands areas include fewer vertical wells required to define the resource area, and more confidently placed horizontal wells for optimal production.
References
- Steam Assisted Gravity Drainage – visit www.nexeninc.com to find more details on this process.
- Goodway, W., Chen, T., and Downton, J., 1997, Improved AVO fluid detection and lithology discrimination using Lame petrophysical parameters; "Lambda*rho", "mu*rho" and "lambda/mu fluid stack", from P and S inversions: 1997, 67th Annual International Meeting., SEG Expanded Abstracts, p183-186.
- Dumitrescu, C., Weston Bellman, L., and Williams, A., 2005, Delineating Productive Reservoir in the Canadian Oil Sands using Neural Networks Approach, CSEG Technical Abstracts.