
Abstract
Cross-plotting has evolved to be a widely used technique in AVO analysis, as it enables the simultaneous and meaningful evaluation of two attributes with ease. Generally, common lithology units and fluid types cluster together in AVO cross plot space, allowing identification of both the background lithology trends and anomalous off-trend aggregations that could be associated with hydrocarbons.
AVO crossplotting has been successfully utilized to quantify anomalous seismic responses, i.e. deviant or anomalous events from well-defined background lithology trends. While initially AVO crossplotting typically used the intercept and gradient to demonstrate its value in AVO analysis, improved petrophysical discrimination of rock properties was later demonstrated by using derived elastic parameter crossplots. All cross plotting is based on the premise that data which is anomalous statistically, is geologically interesting.
It would be interesting to extend this 2D crossplotting approach to three dimensions and assess the advantages that accrue in doing so. Another useful idea is to examine the effect of HFR on pre-stack data in AVO cross-plot space.
This work begins by first visualizing different combinations of the measured well log parameters (P-velocity, S-velocity, density, porosity, and gamma ray) in two and three dimensions. Next, the observed patterns are visualized and compared in the derived elastic parameter crossplot space. The datasets used comprise different lithologic depositions and areas. This analysis is then extended to 3D crossplot space for both well log and 3D seismic data. Clusters hanging in 3D space are more readily recognizable and diagnostic, resulting in more accurate, reliable and hence useful interpretation.
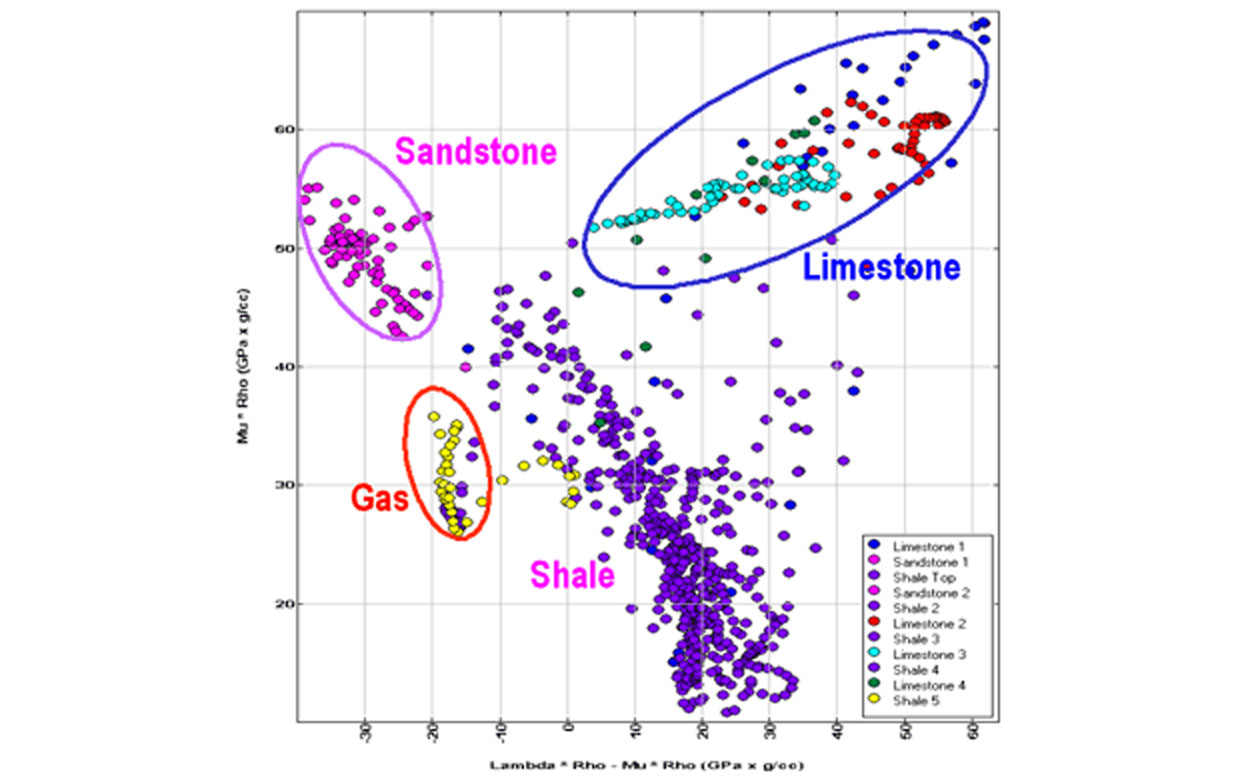
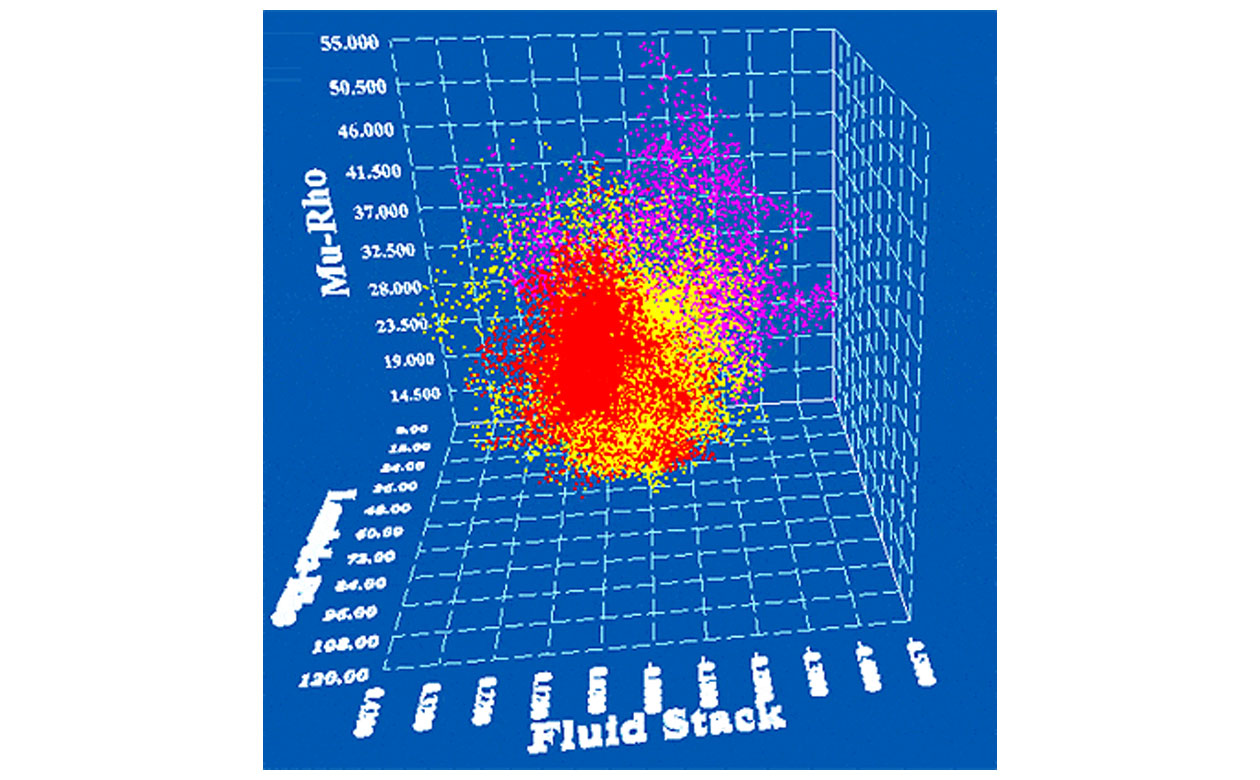
With any three attributes seen on a 3D cross plot together, it is possible to look through more data quickly and conveniently. It is not just a planar 2D view that one usually looks at, rather the disposition of individual clusters in a 3D cube which can be turned in any direction to get a detailed understanding of their arrangement or distribution. The 3D cross-plotting visualization of LMR (Lambda--Mu—Rho) attributes enables the display of cluster distribution corresponding to different lithologies, when properly colour-coded. Such analyses are not so revealing on 2D cross plots. AVO interpretation based on 3D cross-plotting is more insightful, reliable, accurate and so more useful. Cross-plotting for AVO analysis done on data with HFR gives more meaningful patterns to be interpreted for anomalies.
Examples will be shown illustrating the advantages of running HFR (High Frequency Restoration) pre-stack and the anomaly detection on cross-plots for Lambda-Mu-Rho (LMR) attributes. HFR helps in getting meaningful clusters on Lambda_Rho-Mu_Rho cross-plots.
Biography
Satinder Chopra works as Manager, Special Projects with Core Lab Reservoir Technologies, Calgary and specializes in AVO/LMR analysis, VSP and Coherence Cube processing. He obtained his M.Phil. (1978) in Physics from Himachal Pradesh University, Shimla, India and worked for more than 13 years for the Oil and Natural Gas Corporation Ltd. India. He has 18 years of experience in the fields of seismic processing, special processing and interpretation. He is a member of SEG, CSEG and EAGE.